Description
Learn how to effectively use the SAT Desmos calculator to improve your math score significantly. Step-by-step guide from basics to pro-level hacks, with proven strategies for 2025 test-takers.
1.Introduction
Using Desmos can speed up your work and help you make better choices when solving SAT math questions. Students who learn to use all the calculator's features often notice a real jump in their scores. The graphing tools, in particular, can make tricky problems easier by letting you visualize what’s going on, which makes many questions easier to solve.We’ll walk you through how to get the most out of Desmos, one step at a time, with a focus on gaining those extra 100 points. To start, you’ll want to figure out which calculator tools work best for different kinds of questions. The more you practice, the more natural it will feel to switch between graphing and calculations—and you’ll start to spot when a picture can crack a tough problem wide open. Plenty of students have improved their SAT Math scores by making the most of Desmos, and you can too. Just remember to double check the SAT Calculator Policy before using any new features. Small improvements in how you use the calculator can lead to big gains in your score. If you follow this guide and practice often, you'll be ready to do your best on test day.
2.The Desmos Decision Matrix: When to Calculate vs. When to Go Visual
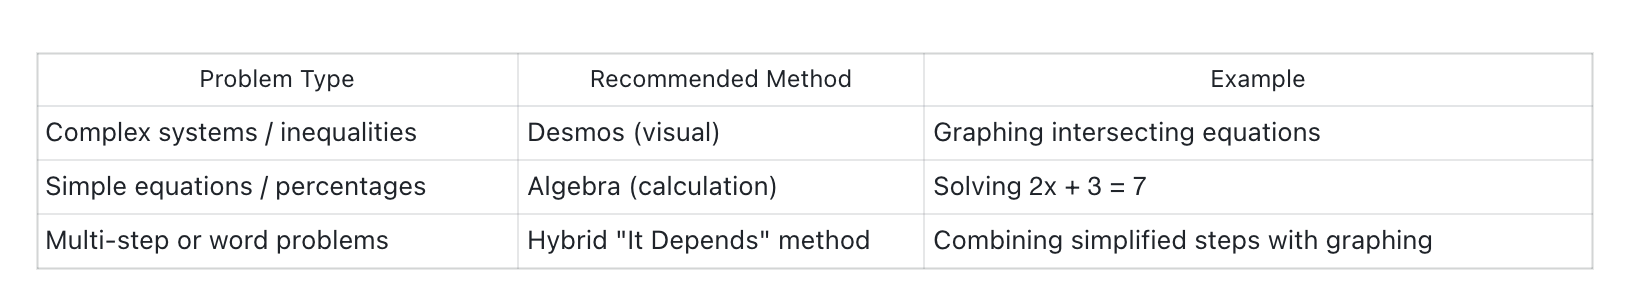
You need to know when to use Desmos and when to solve it by hand on the SAT. Making the right choice will help you work faster and get more answers right. The decision matrix below comes from testing experts and the official Desmos Graphing Calculator guide.
Category 1: Desmos is ALWAYS Faster
Complex problems with multiple parts work best on Desmos. Think about graphing two lines to find where they cross - Desmos shows this instantly. When you need to find the highest point of a curve or check where lines cross, the visual tool makes it simple. Moving sliders around in Desmos helps you see how equations change right away.
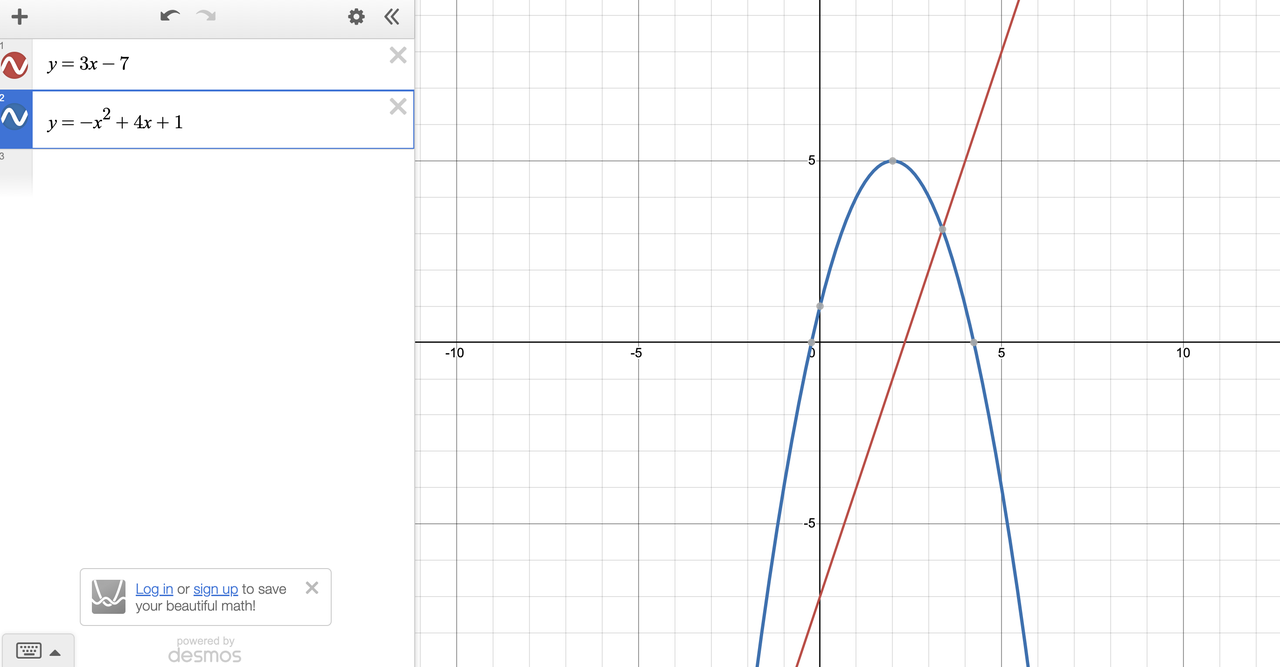
Systems of Equations (Linear or Non-Linear):
Instead of using tedious substitution or elimination methods, simply type both equations into separate lines in Desmos. The solution is the (x, y) coordinate of the point where the graphs intersect.
Example: Solve for y Desmos Solution: Graph both. Click the intersection points. Done in 15 seconds.
y = 3x - 7
y = -x² + 4x + 1
Click here and try to use Desmos for this question. Go practice!
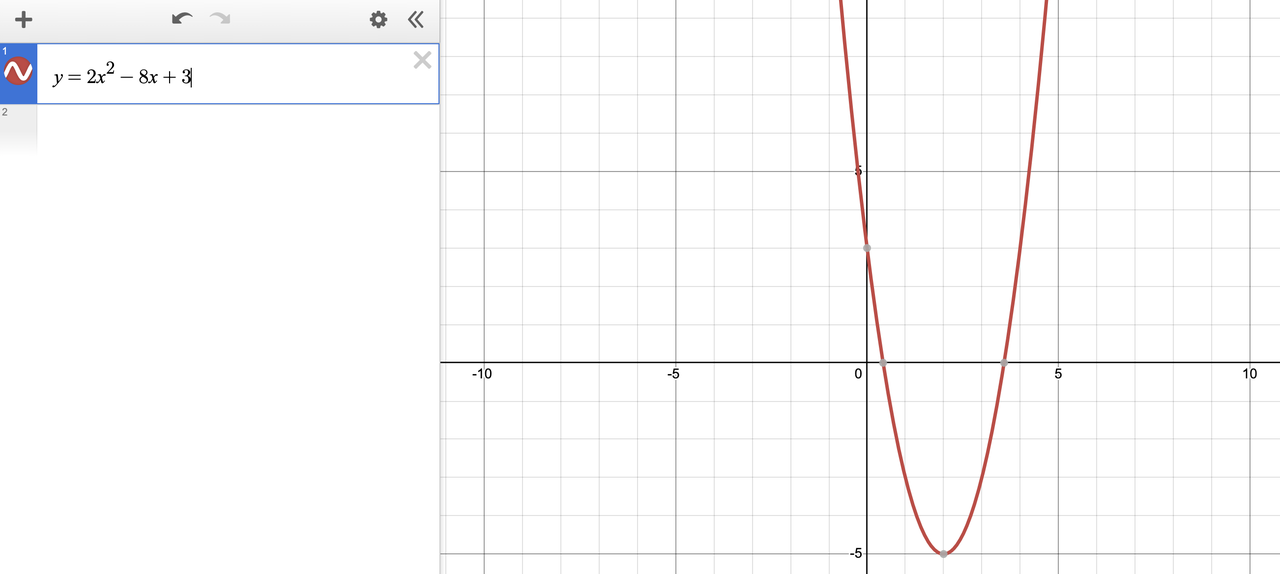
Finding Vertex, Zeros, or Intercepts of Parabolas:
Questions about a parabola's maximum or minimum value (the vertex) or where it crosses the axes (intercepts or "zeros") are tailor-made for Desmos.
Example: "What is the minimum value of the function f(x) = 2x² - 8x + 3?"
Desmos Solution: Type y = 2x² - 8x + 3. Desmos will automatically plot a gray dot at the vertex. Click on it to reveal the coordinates. The y-value is your answer.
Click here and try to use Desmos for this question. Go practice!
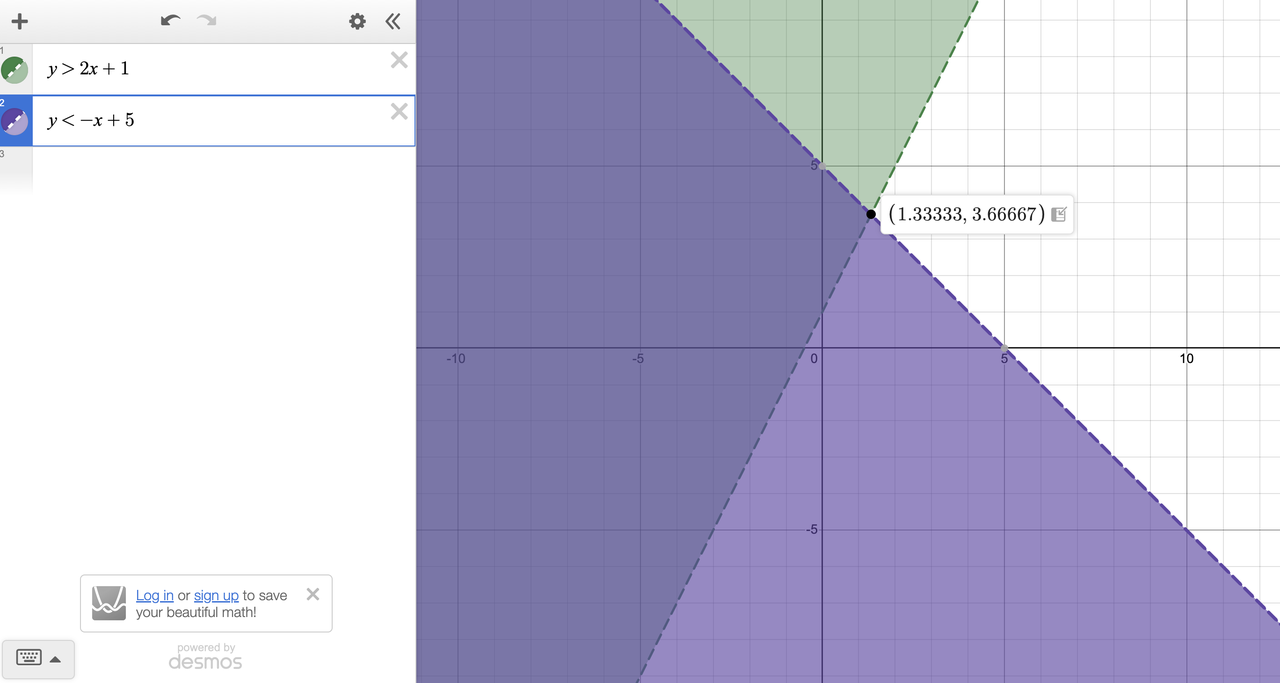
Solving Complex Inequalities:
Graphing inequalities visually makes them incredibly intuitive. Desmos shades the solution regions, making it easy to see where they overlap.
Example: "Which point (x,y) is a solution to the systemy > 2x + 1 and y < -x + 5?
Desmos Solution: Type both inequalities. The answer is any point in the doubly-shaded region. You can even plot the answer choices as points to see which one falls inside.
Click here and try to use Desmos for this question. Go practice!
Category 2: Algebra is USUALLY Faster
Basic math often works better with pencil and paper. Simple equations like "2x + 3 = 7" can be solved quickly in your head. When you need to find the area of a basic shape, using Desmos might waste time.
- Simple Linear Equations (One Variable): Typing 2x + 5 = 15 into a graphing calculator is a waste of precious time. You have to graph y = 2x + 5 and y = 15 and find the intersection.
- Example: "If 4a - 3 = 9, what is the value of a?"
- Algebra Solution: Add 3 to both sides (12), divide by 4. The answer is 3. This takes 5 seconds in your mind.
- Basic Percentage Calculations: Don't graph a percentage problem. Use the basic calculator function or mental math.
- Example: "What is 20% of 300?"
- Algebra Solution:
0.20 * 300 = 60. This is faster than any graphing setup.
- Straightforward Geometry Formulas: If you have the radius and need the area of a circle (A = πr²), just plug it into the basic calculator. Don't try to graph the circle unless the question involves its position on a coordinate plane.
Category 3: The "It Depends" Zone
This is where you can really boost your score. The best SAT test-takers use both algebra and Desmos together to save time.
For example, you often see questions about a ball’s height, like “What is the maximum height for h(t) = -16t² + 96t?”
If you only use algebra, you have to remember the vertex formula and do the math by hand. That takes longer, and it’s easy to make a mistake.
Here’s a smarter way: set up the equation from the word problem, then type y = -16x² + 96x into Desmos. Click on the highest point of the curve—that’s your answer. Desmos gives you the maximum height and when it happens right away, so you don’t have to worry about messing up the math.
3.Level Up Your Desmos Game: From Beginner Moves to Pro-Level Hacks
Mastering the Decision Matrix is step one. Step two is ensuring you can execute flawlessly. Here’s how you can level up your skills to see a quantifiable impact on your SAT score calculator.
Desmos for the Beginner Basics (The 20-Point Boost)
You need to learn how to plot basic shapes like lines and curves. Get used to typing equations quickly and checking if your graphs look right on the screen. Taking these small steps helps you feel more confident and usually adds about 20 points to your practice scores.
- Graphing Functions: Effortlessly type in linear equations (
y=mx+b), quadratic equations (y=ax²+bx+c), and exponential functions (y=a*b^x). - Finding Intersections: Be able to instantly locate and click on the intersection points of any two graphs to find the solution.
Desmos for the Intermediate Moves (The 50-Point Boost)
Go beyond simple plotting to unlock more efficient solutions.
- Using the Table of Values: For any function you graph, click the gear icon and then the table icon. You can input specific x-values to find the corresponding y-values. This is perfect for "which of the following tables represents the function?" questions.
- Finding Min/Max Values: Desmos automatically identifies key points of interest. For a parabola, the vertex (its minimum or maximum) will be marked. For more complex functions, you can trace the graph to see the highest and lowest points in your viewing window.
- Effective Zooming and Tracing: Get comfortable with zooming in and out to find intersections that are off-screen. Click and drag along a line to "trace" it, which can help you estimate values and understand the behavior of a function.
Desmos for the Pro-Level Hacks (The 100-Point Boost)
This is where you separate yourself from the pack. These advanced techniques solve the trickiest SAT math questions with shocking ease.
Slider Magic- Game changer for SAT math questions
- This is a true game-changer. If a question has an unknown constant (like k, a, or c), you can turn it into a slider.
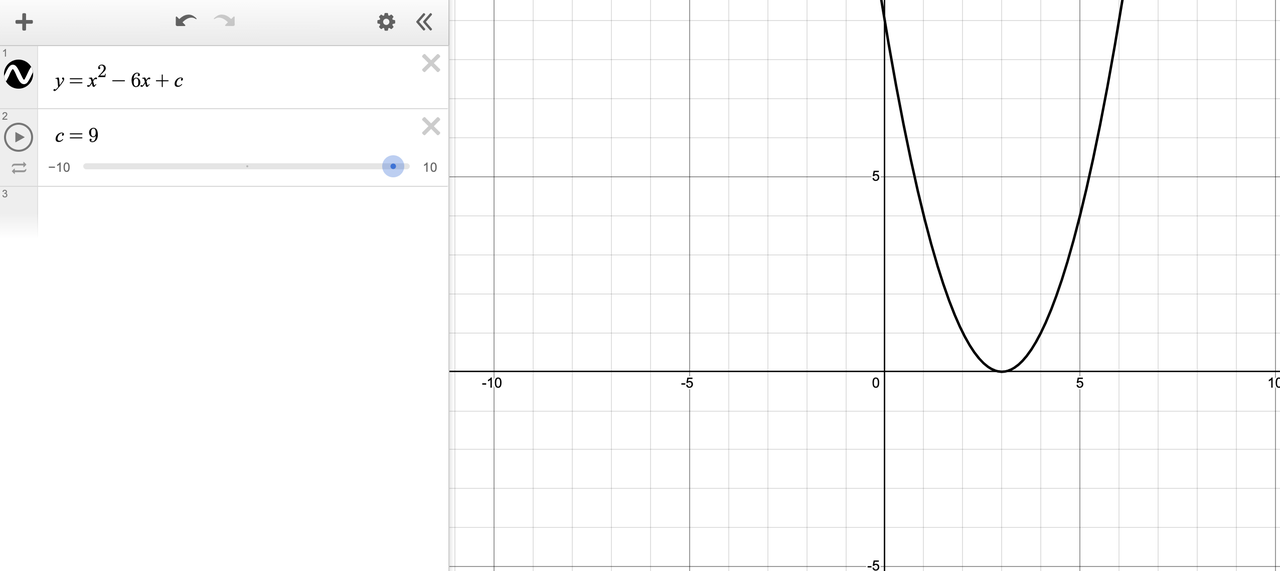
- Example Question: "For what positive value of c does the parabola y = x² - 6x + c have exactly one x-intercept?"
- The Old Way: Use the discriminant formula (b²-4ac = 0), solve for c.
- The Desmos Pro Way: Type
y = x² - 6x + cinto Desmos. It will prompt you to "add slider for c". Click it. Now, simply drag the slider until the parabola's vertex rests perfectly on the x-axis. The value ofcon the slider is your answer. This visual method is faster and nearly impossible to get wrong.
Click here and try to use Desmos for this question. Go practice!
Visualizing Word Problems
- Turn abstract problems into concrete graphs.
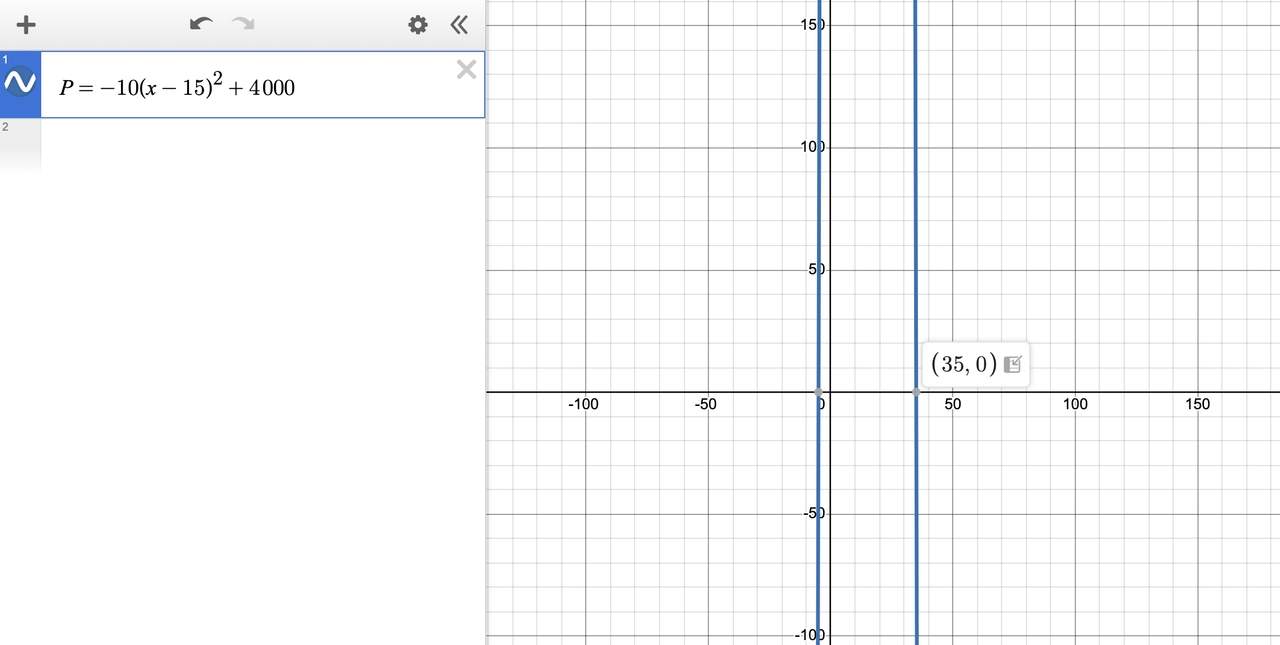
- Example: "A company's profit P, in dollars, is modeled by
P = -10(x-15)² + 4000, where x is the price of a product. What product price maximizes the profit?" - Desmos Solution: Don't even try to analyze the equation. Graph it (using y for P). The vertex represents the maximum point. The x-coordinate of the vertex is the price that maximizes profit.
Click here and try to use Desmos for this question. Go practice!
4.The 3 Biggest Desmos Mistakes That Lower Your Score (And How to Avoid Them)
Many students make mistakes when using Desmos on the SAT. These common errors can really hurt your score, but they're easy to fix once you know what to look for.
Mistake #1: The Typo Trap
Small typing errors can ruin your whole answer. You might forget a minus sign or put in the wrong decimal point, which makes the graph look totally different from what you want. Take a moment to check your work after every step. It's important to make sure what you typed matches the problem you're trying to solve.
Mistake #2: The Interpretation Error
Students often mix up different parts of graphs, like x-intercepts and y-intercepts. Write down exactly what you need to find before you start graphing anything. Make sure you know if you're looking for where lines cross or where a curve hits its highest point. Using Desmos should help prove your answer is right, not make things more confusing.
Mistake #3: The Over-Reliance
Using Desmos for every little calculation is a bad habit. While it's great for seeing graphs and checking work, you should still be able to do basic math in your head.
5.Conclusion: Mastering Desmos for Your Competitive Edge & Start Boosting Your Score Today!
Making the most of Desmos takes careful planning and lots of practice. You need to learn when to use it for graphs, when to solve problems by hand, and how to avoid common mistakes that could cost you points.
Following the official SAT Calculator Guidelines is very important for test day success. Always check your work twice and make sure you're using Desmos the right way.
Try our Free SAT Math Practice to build your skills step by step. Regular practice will help you use Desmos without even thinking about it. This will give you an edge over other students on test day.
FAQs
1. How exactly can Desmos help me gain 100 points on the SAT Math section?A: Desmos can boost your score by saving time on complex problems, helping you visualize difficult concepts, and reducing calculation errors. Students who master our three-tier approach (basic graphing, intermediate techniques, and pro-level hacks) typically see improvements of 20 points at the beginner level, 50 points at the intermediate level, and up to 100 points with advanced techniques.
2. Will Desmos work for all SAT Math questions?
A: No, and that's a key insight! Our Decision Matrix shows when to use Desmos (complex graphs, systems of equations), when to use algebra (simple calculations), and when to combine both approaches. Learning when NOT to use Desmos is just as important as knowing when to use it.
3.How long will it take me to get good enough with Desmos to see results?
A: Most students see noticeable improvements after just 2-3 weeks of focused practice. Basic features can be mastered in a few study sessions, while advanced techniques like using sliders for parametric equations typically take 4-6 weeks to fully integrate into your problem-solving approach.
4. What are the most common mistakes when using Desmos on the SAT?
A: The biggest mistakes are typing errors, misinterpreting graphs, and over-relying on the calculator for simple calculations.
5. How long does it take to master Desmos for the SAT? A: With regular practice, you can master basic features in a few weeks and advanced techniques in 2-3 months.