
Introduction
Some SAT math questions seem intentionally designed to waste your time, bait you into complex algebra, and trip you up right before the finish line. They are the reason students spend hours on SAT math practice with mixed results. But what if most of these intimidating problems had a simple, visual shortcut?They do. It's called the SAT Desmos graphing calculator, and using it strategically is the key to turning the test's hard questions into easy ones.
In this article, we'll look at 7 real examples that show you better ways to solve math problems. Traditional methods often take too long and lead to mistakes. With Desmos, you can solve most problems in under a minute. These tips work in the real world, not just in practice. Understanding how to use Desmos effectively can improve your score significantly. You'll learn shortcuts that make even the hardest questions manageable.
Case Study 1: The Complex System of Equations
The Problem: A system of two equations is given:y = -1.25x + 7.5y = 0.5x² + 2x - 3 An (x, y) solution to the system is given. What is the value of x?
- The Slow Way (The Trap): Set the equations equal to each other: -1.25x + 7.5 = 0.5x² + 2x - 3. Then, move everything to one side to create a messy quadratic equation: 0.5x² + 3.25x - 10.5 = 0. Now you have to solve this using the quadratic formula, dealing with decimals all the way. This is a 3-minute, high-risk process.
- The Desmos Way (The Solution): First,Open Desmos
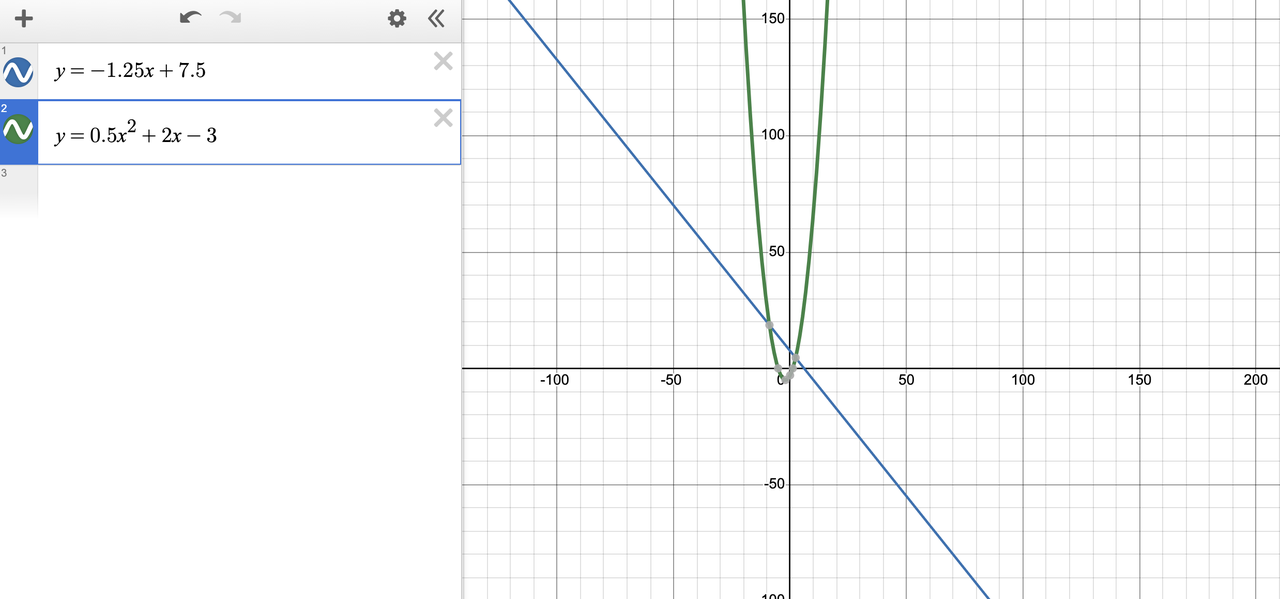
- In the first line, type: y = -1.25x + 7.5
- In the second line, type: y = 0.5x^2 + 2x - 3
- The two graphs will appear on the screen. Desmos automatically places gray dots at their intersection points. Click on them. The coordinates of the solutions will instantly appear. The question asks for the x-value. You're done. (The solutions are at x=-9.14 and x=2.64).
- Pro Tip: If you can't see the intersection points, don't be afraid to use the scroll wheel to zoom out or click and drag the canvas to move your view.
Case Study 2: The "Find the Vertex/Zeros" Parabola
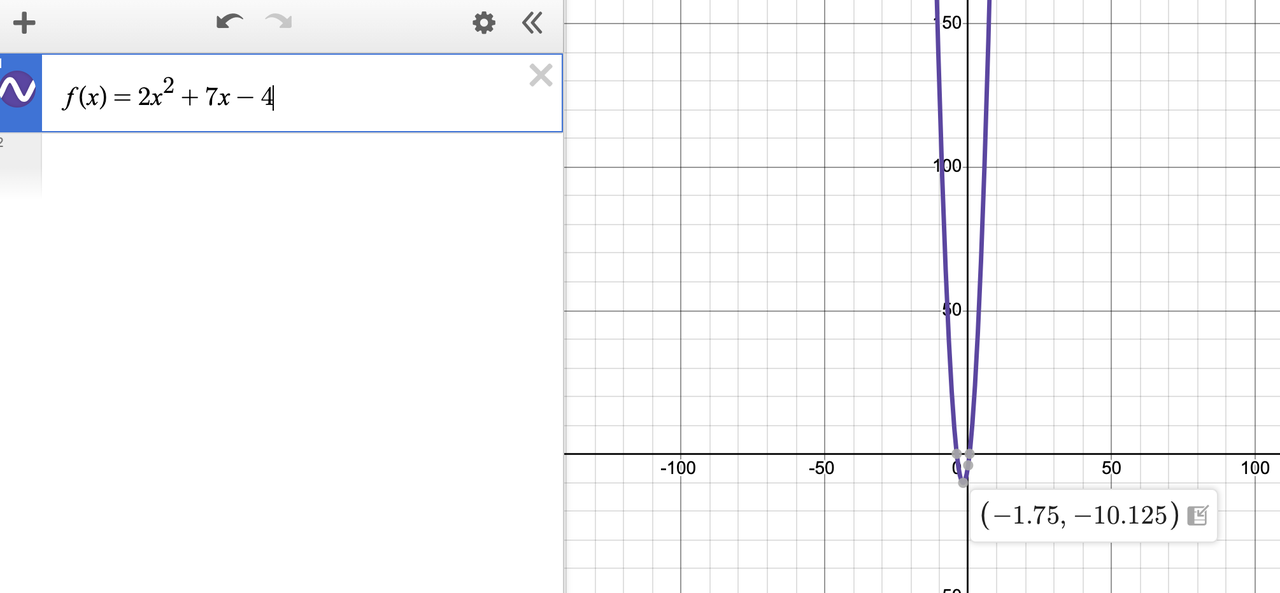
The Problem: The function f(x) = 2x² + 7x - 4 is graphed in the xy-plane. What is the x-coordinate of the parabola's vertex?
- The Slow Way: Remember and correctly apply the formula for the x-coordinate of the vertex: x = -b / 2a. Here, x = -7 / (2*2), which simplifies to x = -7/4 or -1.75. This is fast if you remember the formula perfectly under pressure, but it's easy to make a sign error.
- The Desmos Way:
- Open Desmos once again. Type y = 2x^2 + 7x - 4 into Desmos.
- The parabola appears instantly. Desmos knows the vertex is a key point of interest and automatically marks it with a gray dot.
- Click the dot. The coordinates (-1.75, -10.125) appear. The x-coordinate is -1.75. No formulas, no calculations, zero chance of a sign error.
- Pro Tip: This same method instantly gives you the y-intercept (where the graph crosses the y-axis) and the x-intercepts ("zeros"), which are also marked with gray dots.
Case Study 3: The Shaded Inequality Region
The Problem: Which of the following points is a solution to the system of inequalities below?y > 2x - 3y <= -x + 6 a) (1, 1) b) (5, 8) c) (3, 3) d) (0, -4).
- The Slow Way: Substitute the x and y values from each answer choice into both inequalities to see which point satisfies both conditions. This requires up to eight separate calculations. It's tedious and a recipe for small mistakes.
- The Desmos Wayc. Two shaded regions will instantly appear. The solution to the system is the area where the two shaded regions overlap.d. Now, let's plot the answer choices. You can type them in as coordinates:
(1, 1),(5, 8),(3, 3), and(0, -4). Desmos will put all four points on the graph.e. Just look for the point that's in the overlapping shaded area. As you can see below, only one point, (1, 1), is in the solution zone. You're done. No calculations, no chance of error.- Open Desmos once again. In the first line, type: y > 2x - 3
- In the second line, type: y <= -x + 6
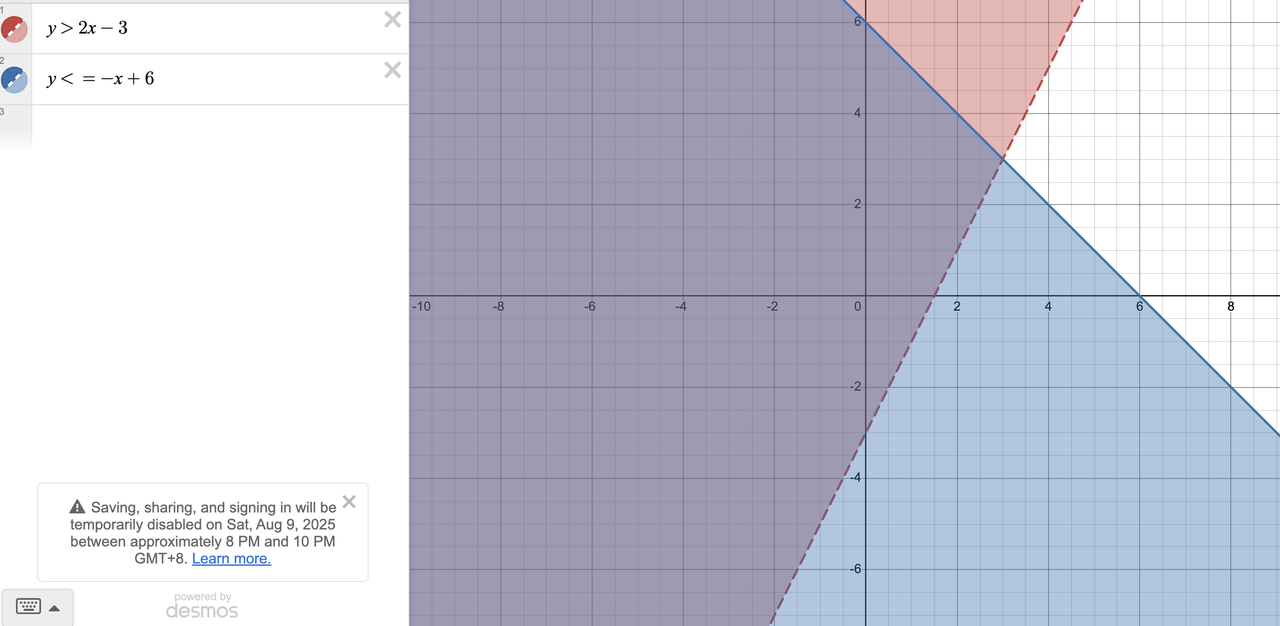
Pro Tip: Pay attention to the lines! Desmos automatically shows a dotted line for > and < (meaning points on the line are not included) and a solid line for ≥ and ≤ (meaning points on the line are included). This can be a game-changer for tricky questions where a point is right on the edge.
Case Study 4: The "Which Point Lies on the Circle?" Question
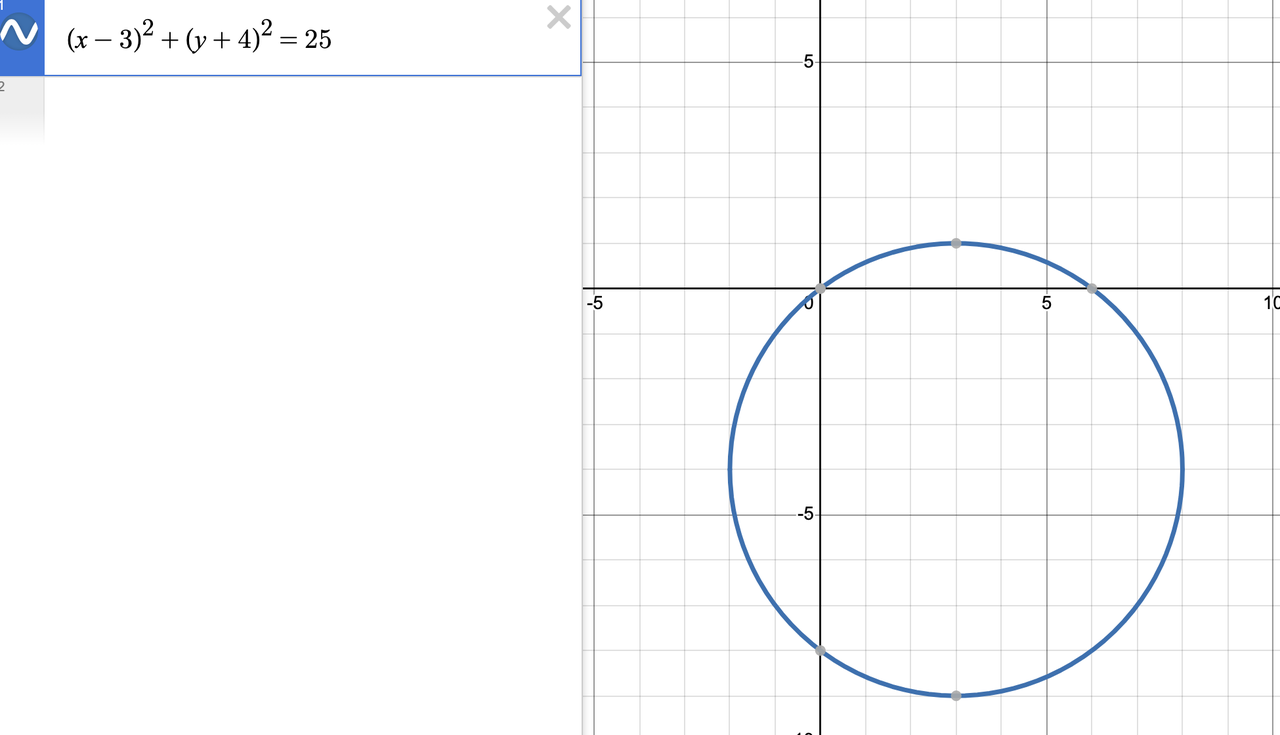
The Problem: A circle in the xy-plane has the equation (x - 3)² + (y + 4)² = 25. Which of the following points lies in the circle? a) (3, -4) b) (6, 0) c) (7, -1) d) (0, 0)
- The Slow Way: Plug the x and y coordinates from each answer choice into the equation and see which one makes the equation true. For choice (c): (7-3)² + (-1+4)² = 4² + 3² = 16 + 9 = 25. This works, but you have to test them one by one.
- The Desmos Way:
- Open Desmos once again. Type the entire circle equation into Desmos: (x - 3)^2 + (y + 4)^2 = 25. The circle will appear.
- In the lines below, simply type the coordinates of the answer choices:
(3,-4),(6,0),(7,-1),(0,0). - Desmos will plot all four points. You can visually see in a microsecond that only one point,
(7,-1), lies directly on the circumference of the circle.
- Pro Tip: You can label the points by clicking the gear icon. This helps you keep track if you have multiple points on the screen.
Case Study 5: The Statistical Modeling Question
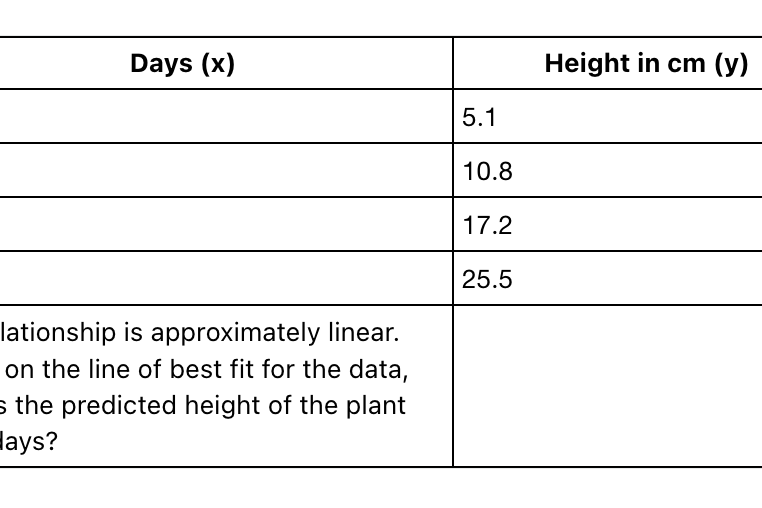
The Problem:A botanist tracks the growth of a plant. The data is in the table below.
- The Slow Way: Manually estimate the slope and intercept, or pick two points to create a line. This is inaccurate and time-consuming.
- The Desmos Way:
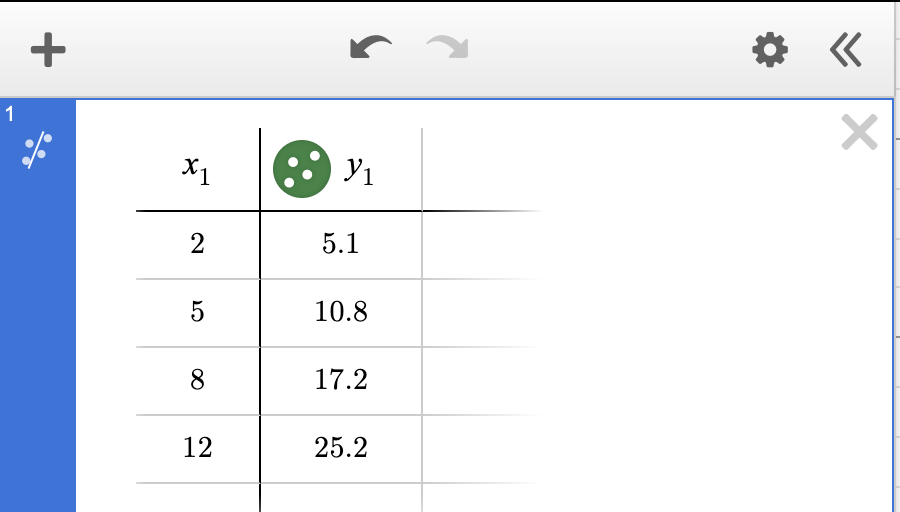
- Open Desmos once again. First, we need to get the data from the problem into Desmos.
Step 2: Find the Line of Best Fit
Now, let's have Desmos do the heavy lifting and calculate the line of best fit.
- In the second input box, right below your table, type the linear regression formula: y₁ ~ mx₁ + b
- Important Tips:
- Make sure you type
x₁andy₁(with the subscript 1). You can do this by simply typingy1andx1, and Desmos will automatically format it. This tells Desmos to use the data from your table. - Use the tilde symbol
~, not an equal sign=. The tilde tells Desmos to "find a model that best fits this data" instead of "draw this exact line."
- Make sure you type
Desmos will instantly do the calculation for you, listing the values for your parameters m (the slope) and b (the y-intercept). It will also graph the line of best fit over your data points on the right.From the Desmos output, we get:
m ≈ 2.05b ≈ 0.9
So, the equation for our line of best fit is approximately y = 2.05x + 0.9.
Step 3: Make the Prediction
The question asks for the predicted height of the plant at 10 days, which means we need to find the value of y when x = 10. You have two super-fast ways to do this:
Method A (The Equation Method): In a new input box, just use the m and b values you found and plug in 10 for x: 2.05 * 10 + 0.9 Desmos will immediately give you the answer: 21.4.
Method B (The Graphing Method - Even Faster!): In a new input box, type x = 10. Desmos will draw a vertical line on the graph. The point where this line crosses your line of best fit is your answer. Simply click on that intersection point, and Desmos will display its coordinates: (10, 21.4).Final Answer: Based on the line of best fit, the predicted height of the plant at 10 days is 21.4 cm.
Case Study 6: The "What If?" Word Problem with Sliders
The Problem: A projectile's height is modeled by h(t) = -4.9t² + vt + 2, where h is height, t is time, and v is the initial upward velocity. For the projectile to reach a height of exactly 60 meters, which of the following could be the value of v? a) 15 b) 25 c) 35 d) 45
- The Slow Way: Substitute each value of
vfrom the answer choices into the equation and then solve the resulting quadratic to see if the maximum height is at least 60. This is incredibly slow. - The Desmos Way:
- Open Desmos once again. Type the equation into Desmos, using
vas a variable: y = -4.9x^2 + vx + 2. - Desmos will prompt you to "add slider for v". Click it.
- Type
y=60to draw a horizontal line at the target height. - Now, simply drag the slider for
v. Watch how the parabola changes. Find a value forvwhere the vertex (the peak) of the parabola just touches or goes above they=60line. You'll quickly see that values around v=35 work.
- Open Desmos once again. Type the equation into Desmos, using
- Pro Tip: You can click on the number next to the slider to set its range. If the answer choices are from 10 to 50, set the slider's range to match so you don't waste time exploring irrelevant values.
From Examples to Instinct: How to Spot These Opportunities on Your Own
Recognizing when to use these techniques is a skill in itself. Look for the "signature" of a Desmos-friendly problem:
- Complex Functions: Any question with a messy quadratic, a system of equations, or an unfamiliar function type is a prime candidate.
- Visual Components: Questions about graphs, intersections, vertices, transformations, or shaded regions are begging for a visual solution.
- "What if?" Scenarios: Any problem with a variable constant (like 'k', 'a', or 'c') and asks "for what value of..." is often perfect for the slider feature.
- Tables of Data: If you see a table and the words "line of best fit" or "linear model," your first thought should be the Desmos regression tool.
The only way to develop this intuitive feel is through repetition. You need to see these patterns so many times that recognizing them under pressure becomes automatic. This is the difference between knowing a trick and having a reliable strategy.
Conclusion & Next Steps: From Clever Tricks to Consistent SAT Success
The case studies show how Desmos helps solve SAT math problems. By learning to use Desmos instead of doing calculations by hand, students can solve problems faster and feel more confident about their answers on test day. These tools help you understand math better.Start using these methods in your practice today. Our AI Practice Arena gives you plenty of chances to use Desmos tricks. Practicing these skills will help you get better scores on the SAT Math section.
FAQ
Q: What is Desmos and how can it help with SAT Math?
A: Desmos is a powerful online graphing calculator that helps solve complex SAT Math problems quickly through visual representation and automated calculations.
Q: How much time can I save using Desmos on SAT Math questions?
A: With proper Desmos techniques, you can solve most SAT Math problems in under 60 seconds, compared to several minutes with traditional methods.
Q: Which types of SAT Math questions work best with Desmos?
A: Desmos is most effective for questions involving graphs, systems of equations, inequalities, and function transformations.
Q: How long does it take to master Desmos for the SAT?
A: With regular practice using provided case studies, most students can master essential Desmos techniques in 2-3 weeks.